As gardeners, we are always trying to be in tune with the weather, and how it impacts our gardens. Each newsletter, I try to provide some timely, weather information so that you know what has happened and what may be coming. Recently, I had a chance to talk with Mike Iacono, Chief Scientist at the Blue Hill Observatory. The observatory’s mission is to foster public understanding of Earth’s weather, climate and environmental systems and to continue to produce, maintain, and analyze a meticulous, consistent record of weather and climate observations.
In my newsletters, I often reference some of the incredible data they have from observations over 140 years. Sometimes I reference the long-term data, but more often I look at the monthly and annual data.
In fact, Mike’s greatest passion in his work has been to make the incredible quantity and quality of data they have at Blue Hill available to anyone with an interest. You can track their daily observations or reference longer term information from their 140 years of observing weather. While you can look at the raw, daily information, most of us prefer their easily absorbed graphs that reveal the trends in a more friendly presentation.
We started with a general discussion of climate and weather, and he helped to explain the difference by saying that weather is what we get on a daily basis, while climate is what we expect based upon long term trends and expectations. Weather can vary around what is expected, and as weather continues to be warmer than expectations, it will impact and alter the climate expectations.
We talked about the long term shifts in climate over the length of earth’s existence, and he explained that the ice ages and major warmings occur because of technical issues relating to earth positioning and angles related to the sun, and that we have been in a stable climate for the past 10,000 years.
With the stable climate for such a long time, Mike said that we have experienced a significant 2.5ºC increase since 1900 as measured at Blue Hill. This Annual Mean Temperature graph shows the mean temperatures over 140 years, and you can see the increase starting in the late 1800s when industry started growing. Mike said, “the only factor that explains the increase in temperature is the human increase in CO2 production.”
As gardeners, we are seeing the results of this warming with the drastic shifts in the USDA Plant Hardiness Zone Map. I wrote about the new map last year if you want more insight into the drastic changes over the decade. If you have been gardening in New England for a while, you are seeing new plants become available that can tolerate the warming environment. We also hear about the challenges for native plants like our Sugar Maples that are becoming stressed in the warmer climate as their southern range is moving north. Around Boston, we see some older Sugar Maples not thriving in the warmer climate. Given their long lifespan, we need to plant newer cultivars that can tolerate the heat, if we want them to reach maturity over the next 100 years.
I asked Mike about heavy rain and the droughts we have experienced in recent years and how these are related to the shifting climate. He explained that as temperatures rise, there is more water vapor available in the air, and this results in more rainfall. If you look at the Annual Precipitation graph you can see that the 10 and 30 year means are increasing since 1900, in sync with rising temperatures. I asked how can we have more rainfall on an annual basis but in recent years experience some significant periodic drought. Are the droughts just an aberration? He said that with warmer temperatures and more water vapor in the air, storms can be bigger and drop larger quantities of rain. However, the droughts aren’t as easily explained and may just be an aberration related to specific weather patterns. Let’s hope that we can get out of this pattern of droughts we have been experiencing.
As we have all come to realize over the past five years, gardening around the weather has become a challenge. The hope of getting an inch of rain every week is just not realistic. We need to have some supplemental water, but it is important to pay attention to the weather and forecast, because often two weeks of hot and dry will end in 3″ of rain in 4 hours. This is a compelling reason to look more closely at native plants in our gardens that can tolerate these weather inconsistencies, but if you are growing food, this inconsistent rain can be problematic.
We then talked about the future. He is very concerned that we are already exceeding some of the limits on temperature rise that have been delineated in the scientific community. He talked about the more drastic temperature increases we are seeing in northern and arctic regions. As light-colored ice melts and exposes darker soil, it accelerates the temperature rise as solar radiation is absorbed, and as the temperature rises the ice melts and raises the sea level.
Mike then went into a fascinating theory that is currently being discussed regarding shifting ocean currents and their impact on local climates. We all know the Gulf Stream that brings warm waters up from the Caribbean to help moderate the climate in New England and across the ocean to Greenland and ultimately Europe. Western Europe enjoys a moderate climate despite the fact that much of it is at higher latitudes that tend to be cooler. Part of the current is driven by the highly saline water off Greenland that is heavy and sinks and pulls up the current from the south. The theory is that as the ice melts off the Greenland ice cap and makes the ocean around Greenland less saline and less dense, that it could slow or stop the warming current. It could have a significant impact on the temperature and climate in Europe and significantly decrease temperatures. This could be devastating to Europe’s agriculture and economies. This tremendously complex theory involving the AMOC (Atlantic Meridional Overturning Circulation) that Mike tried to cover in a few minutes, and it is currently being studied.
He stressed that it is a working theory, but it is a good example of how our world is connected in so many ways and interdependent. As a scientist who works closely with collected data, he is careful not to jump to unsubstantiated conclusions, but expresses real concern with where we are going based upon the data he and his team have been collecting for years.
If you are a bit of a geek, like me, spend a little time on the website looking through their data under the Climate and Weather tab. Also, if you have young adults who are interested in the environment and weather, they bring on interns in the summer season. Of course, they also welcome visitors, offer tours, and provide educational programs.
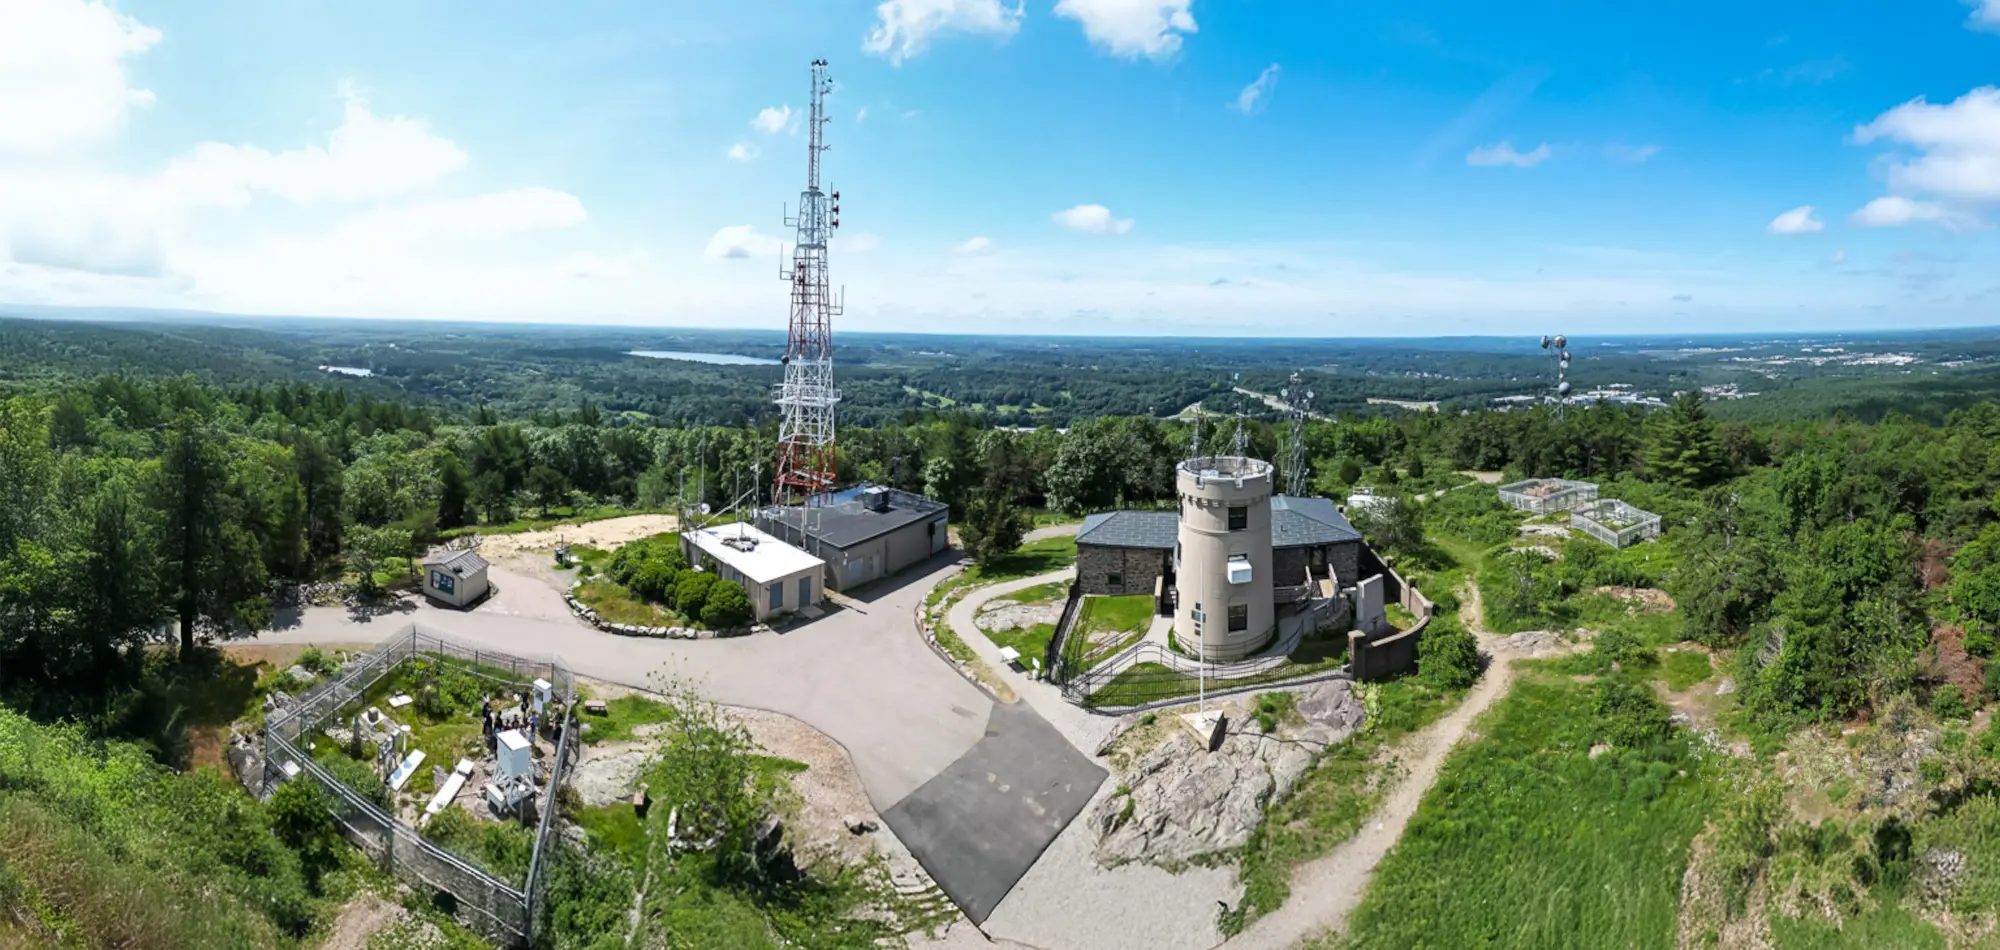
What an incredible resource to have in the Blue Hills of Milton, just southwest of Boston.
